Abstraction 3: Abstraction Plugged
< Back to Building BlockPlace yourself in a hectic, yet common scenario. Your first class of the day begins in 20 minutes and you are in traffic!
When you are in traffic you wonder so many things: What is causing this? Should I switch lanes? Will it help if I speed up until I have to stop? Or should I go at a steady pace? But when you are in the traffic, you can’t see any of these larger patterns. In this activity, you will try to answer these questions by using a tool called NetLogo Web: Traffic. You will use this tool in the next step of this project.
NetLogo Web: Traffic is an online simulation that models traffic patterns and allows you to change different variables on the road (number of cars, speed) to observe the results they have on the traffic.
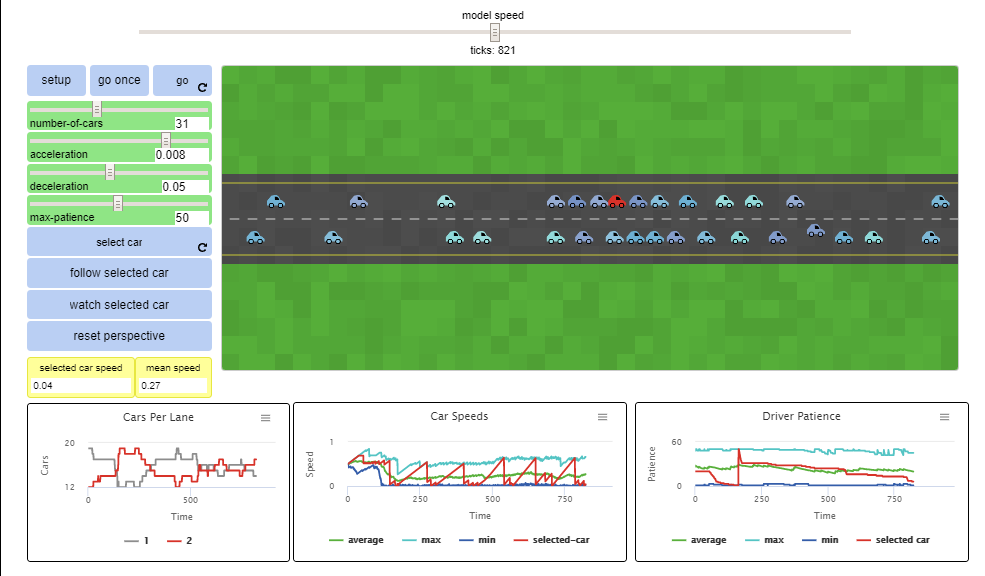
The NetLogo Web: Traffic tool simulates patterns in traffic. You are able to follow one car as it slows down in response to other cars, speeds up as traffic clears, and loses patience and changes lanes. The default simulation has 40 cars on the road and each driver loses patience after 50 slow-downs before switching lanes.
Your Task
- To get started, go to the NetLogo Web -- Traffic tool
- Before you tell the simulation to begin, identify what you see on the screen. What do these sliders do? What will the graphs show when the simulation is running?
- Scroll down the page to the Model Info tab to learn more about the features of this simulation
- Check out the code in the NetLogo Code tab. This code is running the simulation. The developer has set up the tool so that any user can make edits here. Don't worry if it is overwhelming! We also have the sliders on the left side of the simulation for quick and easy changes.
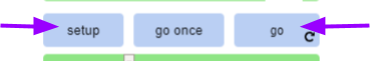
To run this simulation, click on SETUP and then GO.
Notice what happens. Seem familiar? Getting flashbacks to being in traffic yourself? Take note of how the cars act differently when they are lumped in a group to when they act individually.
In this step, you will be abstracting specific components of the simulation to test each independently. The graphs below the simulation will provide you with the insight you need to follow along and answer the following questions:
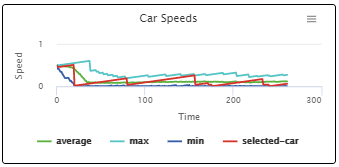
Question 1: What patterns do you notice in the red car? Does abstracting the experience of this one car provide a clearer picture for the other three data points being graphed (average, min, max)?
Question 2: What do you think will happen if you add more cars? If you take some cars away? After answering these questions, go back into the simulation and prove your hypothesis correct or incorrect by adjusting the "number of cars" slider.
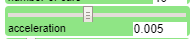
Question 3: What happens when you change the speed? Acceleration changes the rate at which cars speed up when there are no cars in front of them. Does traffic improve if cars speed up as soon as traffic clears? Make a hypothesis and then give it a test!
Question 4: What about when you change the deceleration? If a car slows down more quickly in the face of traffic, what effect does that have? Make a hypothesis and then give it a test!
In real life, most of us try to change lanes when we see that there is traffic ahead. What happens when you increase how quickly a driver will change lanes? If you lower the slider for patience, the drive will change lanes more quickly. See what happens.
Reflection
Reflect on how this simulation helped you understand traffic differently.
If more drivers were educated on the ways in which traffic gets better or worse do you feel traffic conditions could improve?
Write a short report for drivers suggesting what they should do when they encounter traffic. Consider how you can abstract 1 or 2 simple-to-follow pieces of advice that could improve traffic for themselves and those around them.
In your write-up, include how your suggestions may have changed from completing this activity.