LA Practice A2: Identify patterns in texts by abstracting textual data (Activity)
< Back to Building BlockIn literature, patterns allow us to see relationships between characters, predict future plot points, and connect a particular story to another. Seeing these patterns and connections enriches our reading experience from one story to the next.
A dataset can be found in the text of any given work. Any piece of literature amounts to a text file (digital or print) of the author’s words. A digital copy of Rudolpho Anaya’s Bless Me, Ultima can be considered unstructured data since it is written for humans to comprehend but would be difficult for a computer to process the meaning of the text. However, a spreadsheet of all the bird sightings in a city with time, date, neighborhood, etc would be considered structured data since a computer can easily understand the relevance of the data.
Although unstructured data was not designed to be processed by a computer it can be presented as a structured data set. For instance, you could take the first chapter of any novel and create a spreadsheet in which each column represents a character and each row contains nouns and adjectives used in chapter 1 to describe that character. With this data, we could make predictions about the role a character will play in the novel based on the frequency of certain words they use.
For Example: This Chart Shows the Most Common Nouns in Emily Dickinson poems. What inferences and assumptions do you make about the author when you see this data presented in this way:
![[commonnounsEDpoem.png; alt: terms: day, sun, death, heaven, life; the count of each term respectively is 270, 189, 188, 167, 159]](https://projects.ctintegration.org/assets/curriculum/iCT/Patterns/PatternDataELA_Activity/PD-art-chart1.png)
What is the purpose of this exercise?
By taking unstructured data from a text and making it structured, you haven't changed the story in any way but it may change the way you interpret that story. While completing this project, consider how your students could predict and review stories in a whole new way if introduced to this type of activity.
In this step, you are going to convert unstructured data into structured data. In doing this, consider how your perception of this well-known story may have been altered. Completing the tasks below to get started:
- Go to the website https://myshakespeare.com/romeo-and-juliet/act-3-scene-1
- On a blank sheet of paper or using a new spreadsheet record the names of characters who appear in Act 3, Scene 1 of Romeo and Juliet. Each character should be in their own row/line.
- Starting with the first character, count the number of lines they speak in this scene and record the number on the second column of the table.
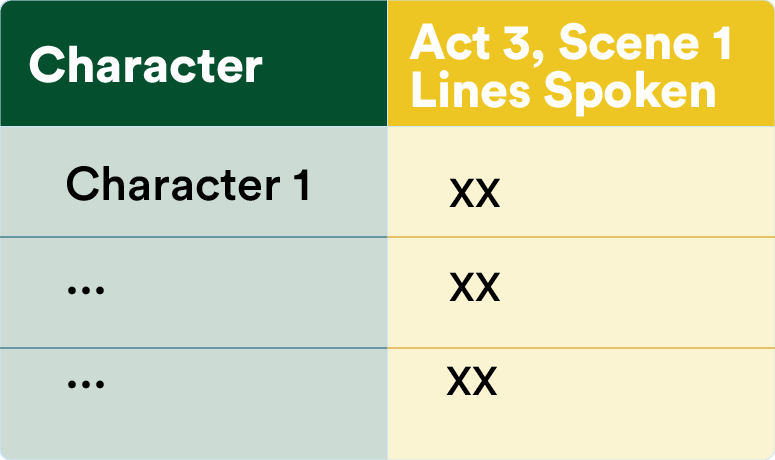
Add your data to column "3.1 Lines" in the table below.
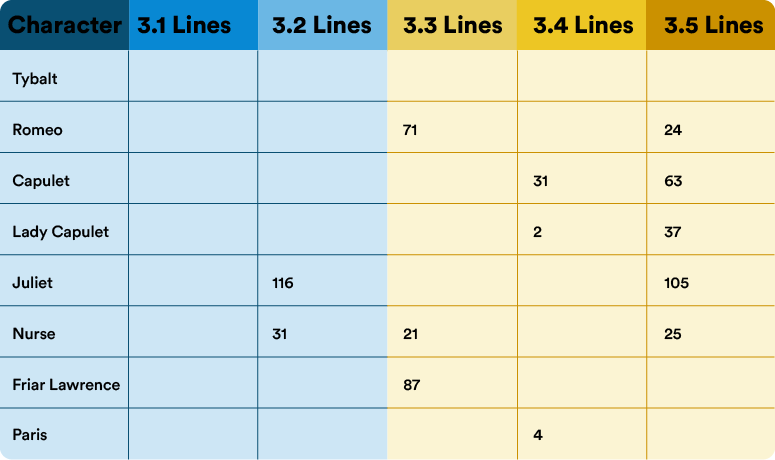
What might this data tell us about the characters in Act 3?
On graph paper (http://print-graph-paper.com/) label an X-axis “Act & Scene” and a Y-axis “Number of Lines.” Choose at least 4 characters to plot on your graph, using different colors for each character.
Alternatively, if you are familiar with creating graphs in Excel or Google Sheets, you could do so there or try out browser-based line graph applications like Holhi (https://charts.hohli.com/) or ChartGo (https://www.chartgo.com/)
What patterns do you see in the graph? What do the patterns confirm about what you already know about the play? What questions do the patterns raise?
Similar to the graph you made in the previous step which gave structure to data from a text, the graph below that depicts the frequency of two words throughout Romeo and Juliet. What could these two words be?
Examine the graph below and combine it with your knowledge of the play, which words do you think this graph depicts? What hypothesis can you come up with about the relationship between these two words and the entire play?
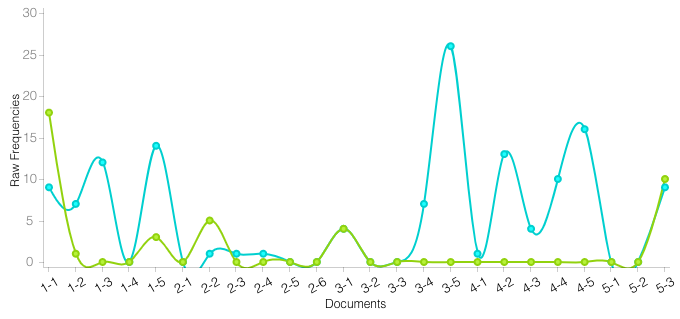
The two words from the graph of the previous step were Capulet and Montague. What did you guess they were?
Whether or not your guess was accurate, how did the data from the graph lead you to make the guess that you did? Would you have made the same guess if the data was presented in a different way?
Had you never read Romeo and Juliet, Would you be able to make a hypothesis about what the author’s intention was for the two families in Act 5 based on the graph?
Below are two pieces of data from Romeo & Juliet: one unstructured, the other structured. While reviewing this qualitative and quantitative evidence, consider the following questions:
- What patterns do you see?
- Can you generalize these patterns to arrive at the main idea presented by this data?
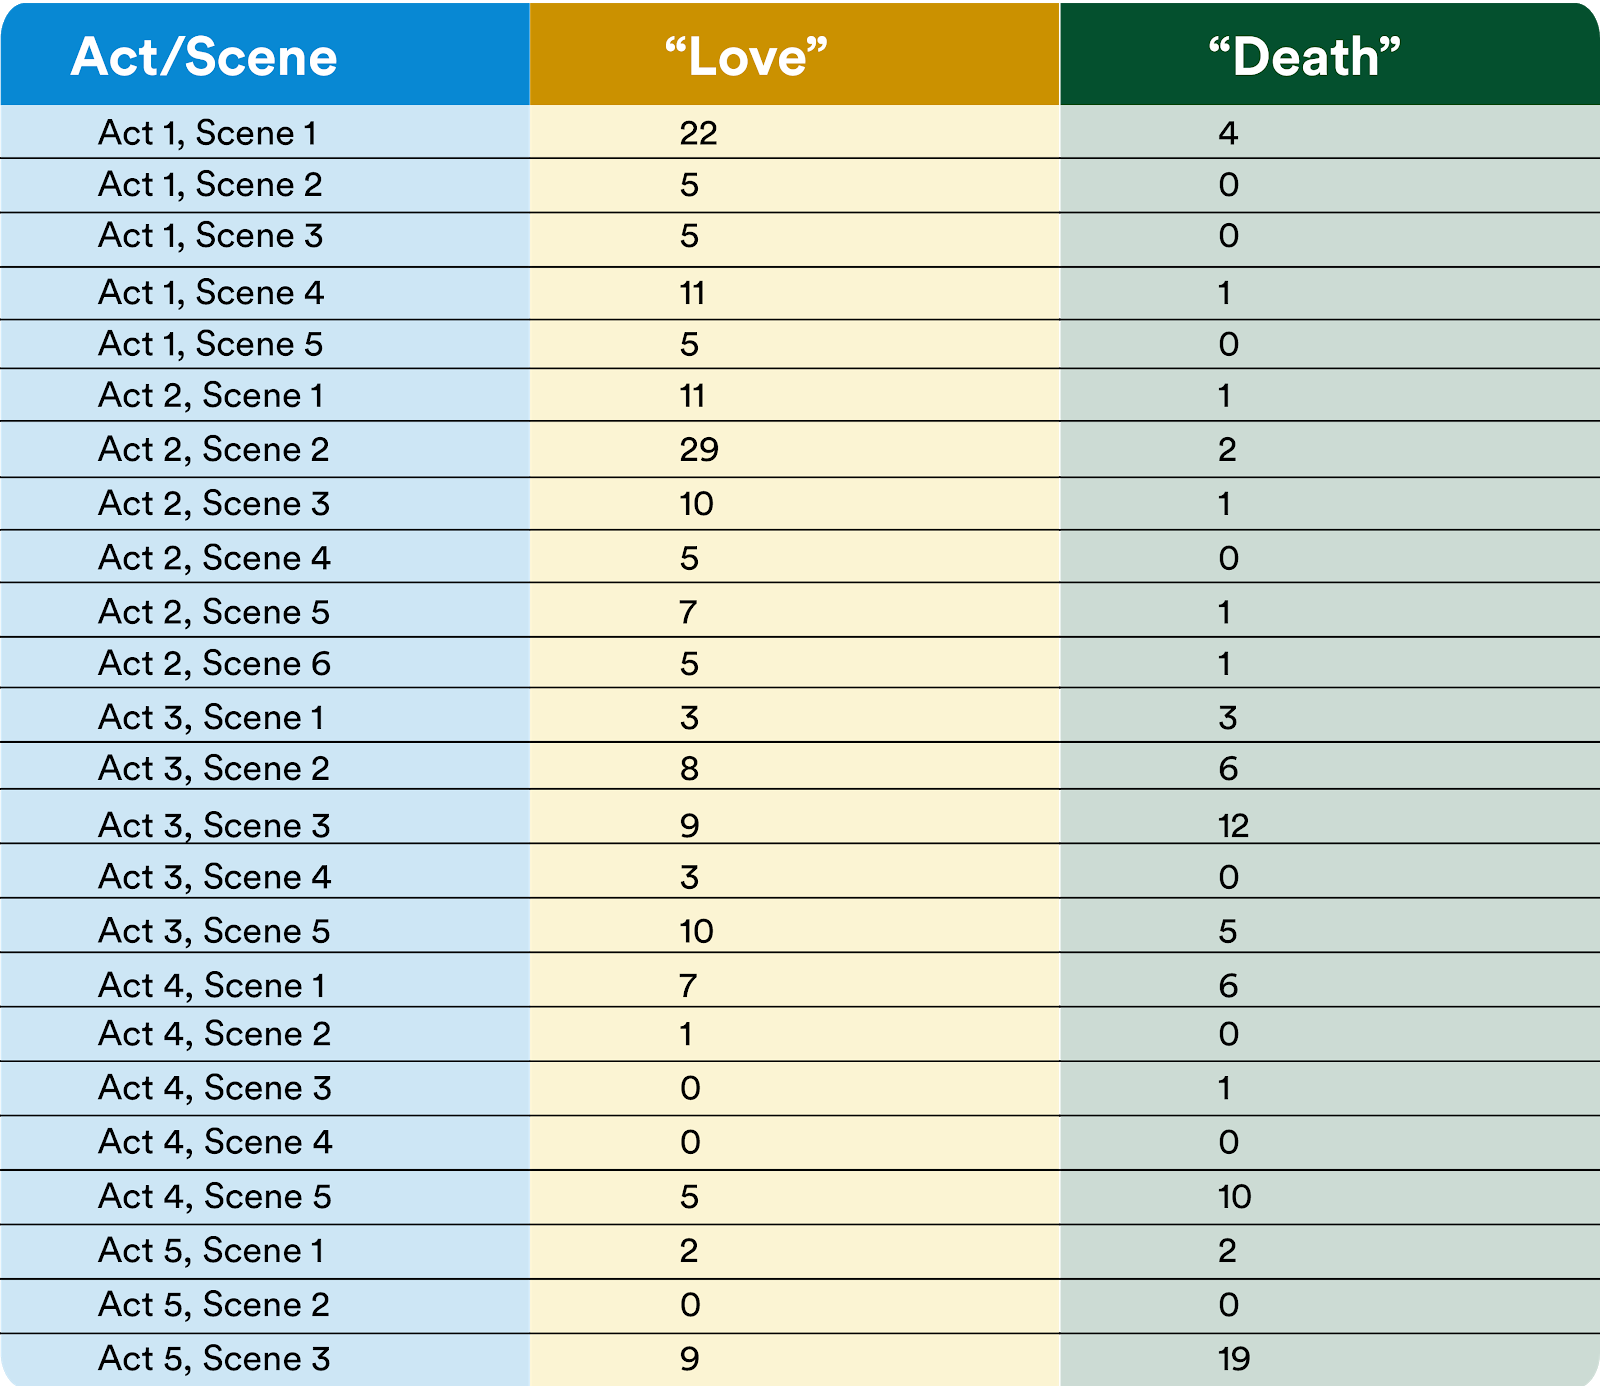
This table shows the frequency of the words “love” and “death” in Romeo & Juliet.
From ACT III, SCENE I. A PUBLIC PLACE.
MERCUTIO
I am hurt.
A plague o' both your houses! I am sped.
Is he gone, and hath nothing?
BENVOLIO
What, art thou hurt?
MERCUTIO
Ay, ay, a scratch, a scratch; marry, 'tis enough. [5]
Where is my page? Go, villain, fetch a surgeon.
[Exit Page]
ROMEO
Courage, man; the hurt cannot be much.
MERCUTIO
No, 'tis not so deep as a well, nor so wide as a
church-door; but 'tis enough,'twill serve: ask for
me to-morrow, and you shall find me a grave man. I [10]
am peppered, I warrant, for this world. A plague o'
both your houses! 'Zounds, a dog, a rat, a mouse, a
cat, to scratch a man to death! a braggart, a
rogue, a villain, that fights by the book of
arithmetic! Why the devil came you between us? I [15]
was hurt under your arm.
ROMEO
I thought all for the best.
MERCUTIO
Help me into some house, Benvolio,
Or I shall faint. A plague o' both your houses!
They have made worms' meat of me: I have it, [20]
And soundly too: your houses!
[Exeunt MERCUTIO and BENVOLIO]
ROMEO
This gentleman, the prince's near ally,
My very friend, hath got his mortal hurt
In my behalf; my reputation stain'd
With Tybalt's slander,--Tybalt, that an hour [25]
Hath been my kinsman! O sweet Juliet,
Thy beauty hath made me effeminate
And in my temper soften'd valour's steel!
[Re-enter BENVOLIO]
BENVOLIO
O Romeo, Romeo, brave Mercutio's dead!
That gallant spirit hath aspired the clouds,
Which too untimely here did scorn the earth.
ROMEO
This day's black fate on more days doth depend;
This but begins the woe, others must end.
Reflection
☞ Think about presenting the two pieces of data in this step for students to reference in a short essay response, what would be the question you’d want students to answer?
☞ Consider a recent text or unit of study that you currently teach with your students. How could plotting data, pattern recognition, and generalization be integrated into this work? In what way(s) would looking at the text through this lens strengthen or enhance the unit’s ELA learning objectives?