LA Practice A3: Conduct a mixed analysis (Activity)
< Back to Building Block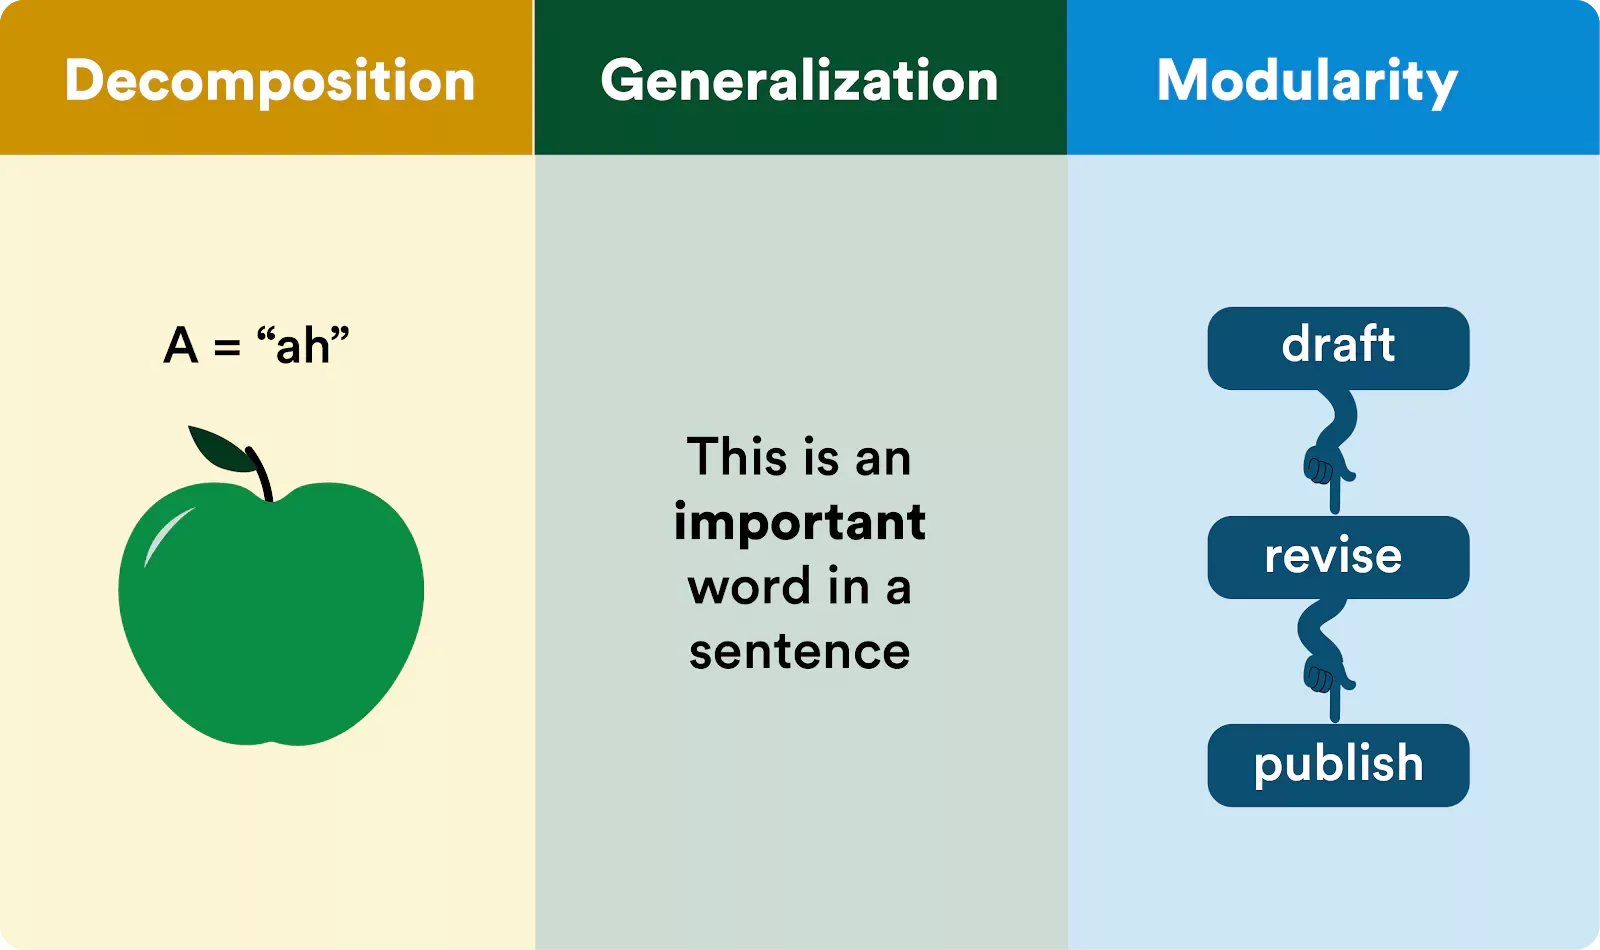
Since our first day of schooling, classrooms focus on the computational thinking practice of abstraction, the process of removing details from a system or object to focus attention on a specific detail of greater importance.
By the end of kindergarten, students understand that a letter is a model representing a specific sound (decomposition). Common Core ELA standards suggest that fourth graders should be able to “refer to details and examples in a text when explaining what the text says explicitly and when drawing inferences from the text” (generalization). And by middle school, students recognize the writing process is composed of individual phases (drafting, revising, editing, publishing, etc.) that come together to create a coherent piece of writing (modularity)
In the prior projects, you have explored how understanding algorithms can help us better understand language conventions and how creating algorithms on Scratch and recognizing patterns in data sets can enhance our studying and interpretation of texts. You have programmed algorithms in Scratch, counted words in a text, and designed graphs but now that you understand those processes.
In this lesson, you will learn how to use a computational tool to help remove unwanted details from a text in order to focus on models that can aid in reading and comprehending a play.
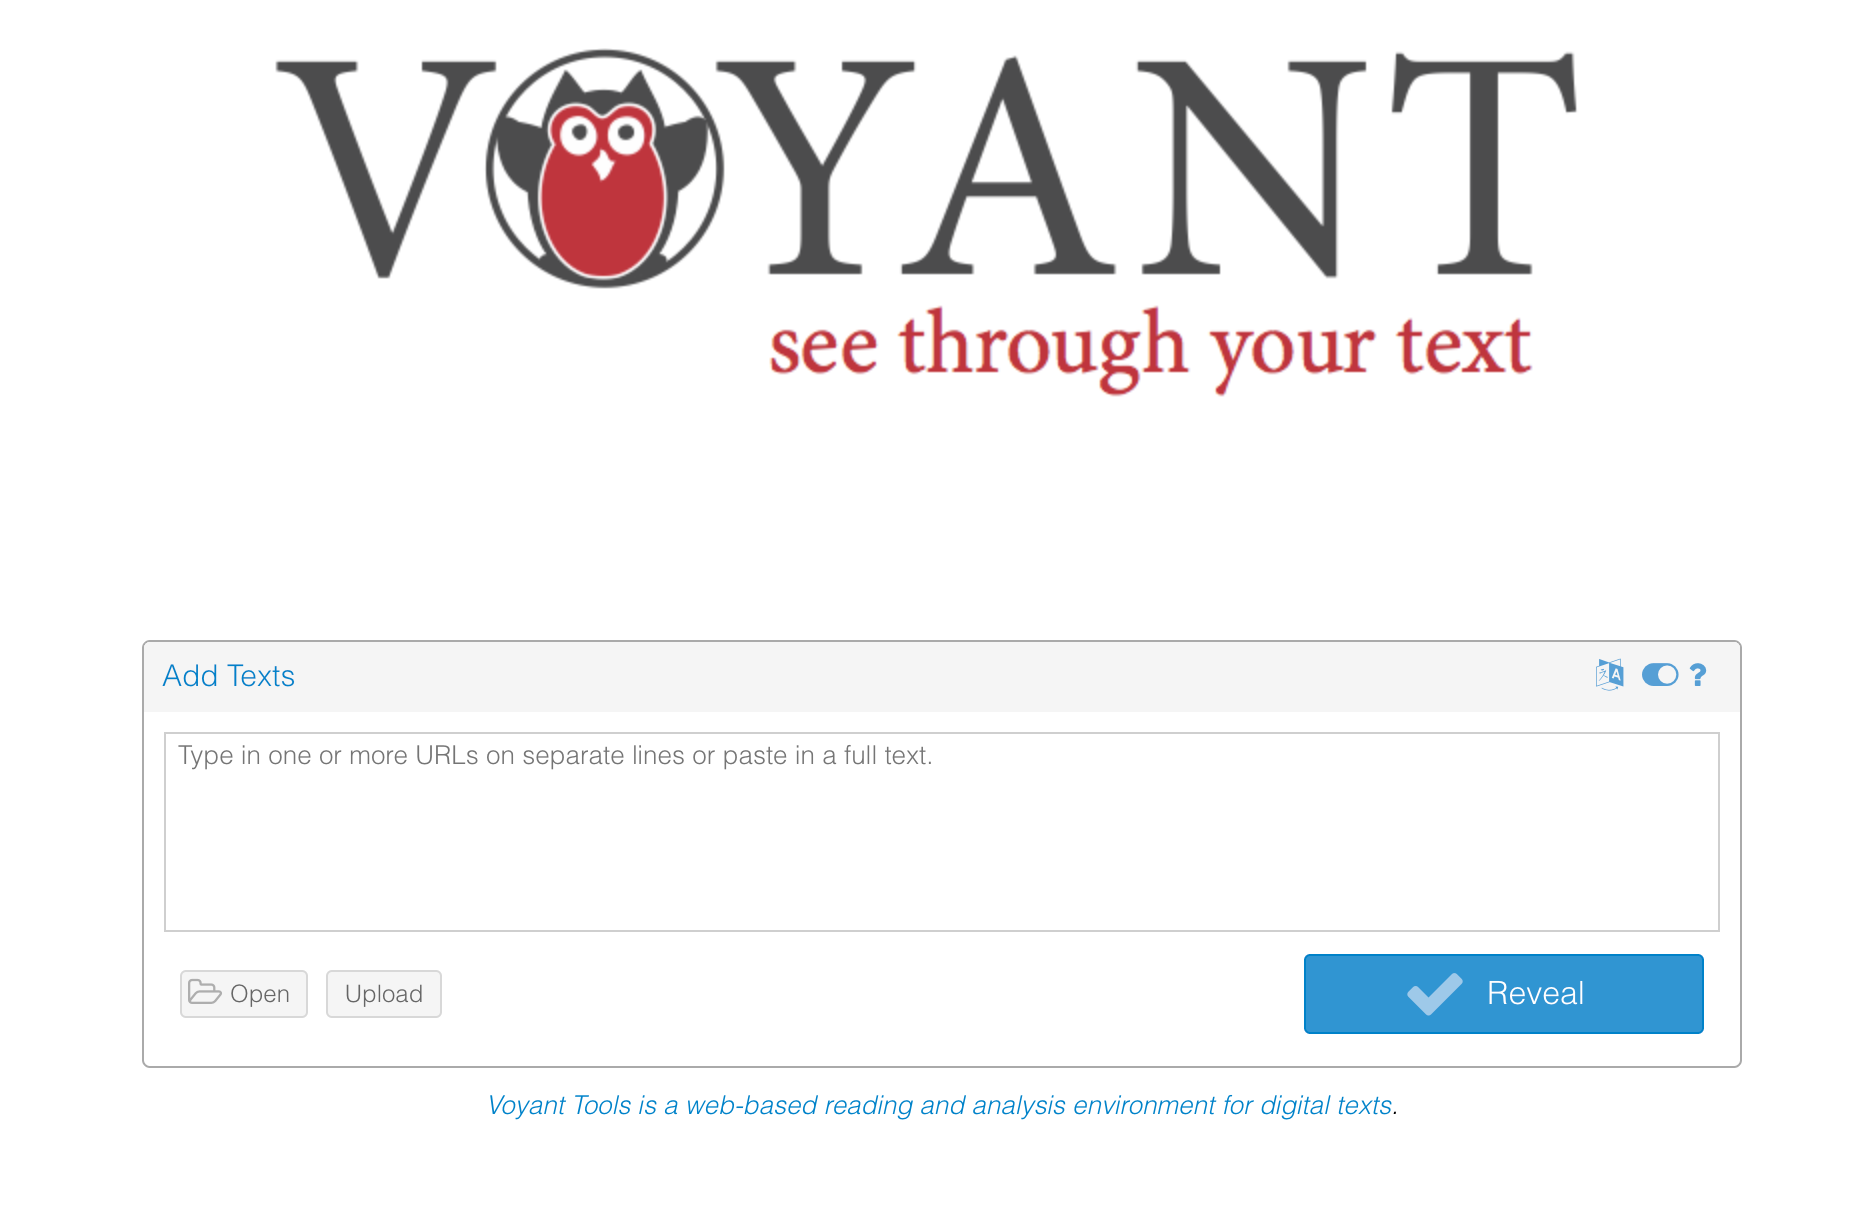
Throughout this activity, you will use Voyant Tools, a web-based application that performs text analysis. Voyant Tools allows for reading and interpretation of a corpus, written materials stored on a computer, by creating visualizations of how language is used in any uploaded text file.
Writings that can be uploaded (either by URL, text file or typed text) to Voyant may be texts such as an essay you wrote in college, Emily Dickinson’s entire body of work or collections of text such as all science fiction novels published by black authors in the 1960s.
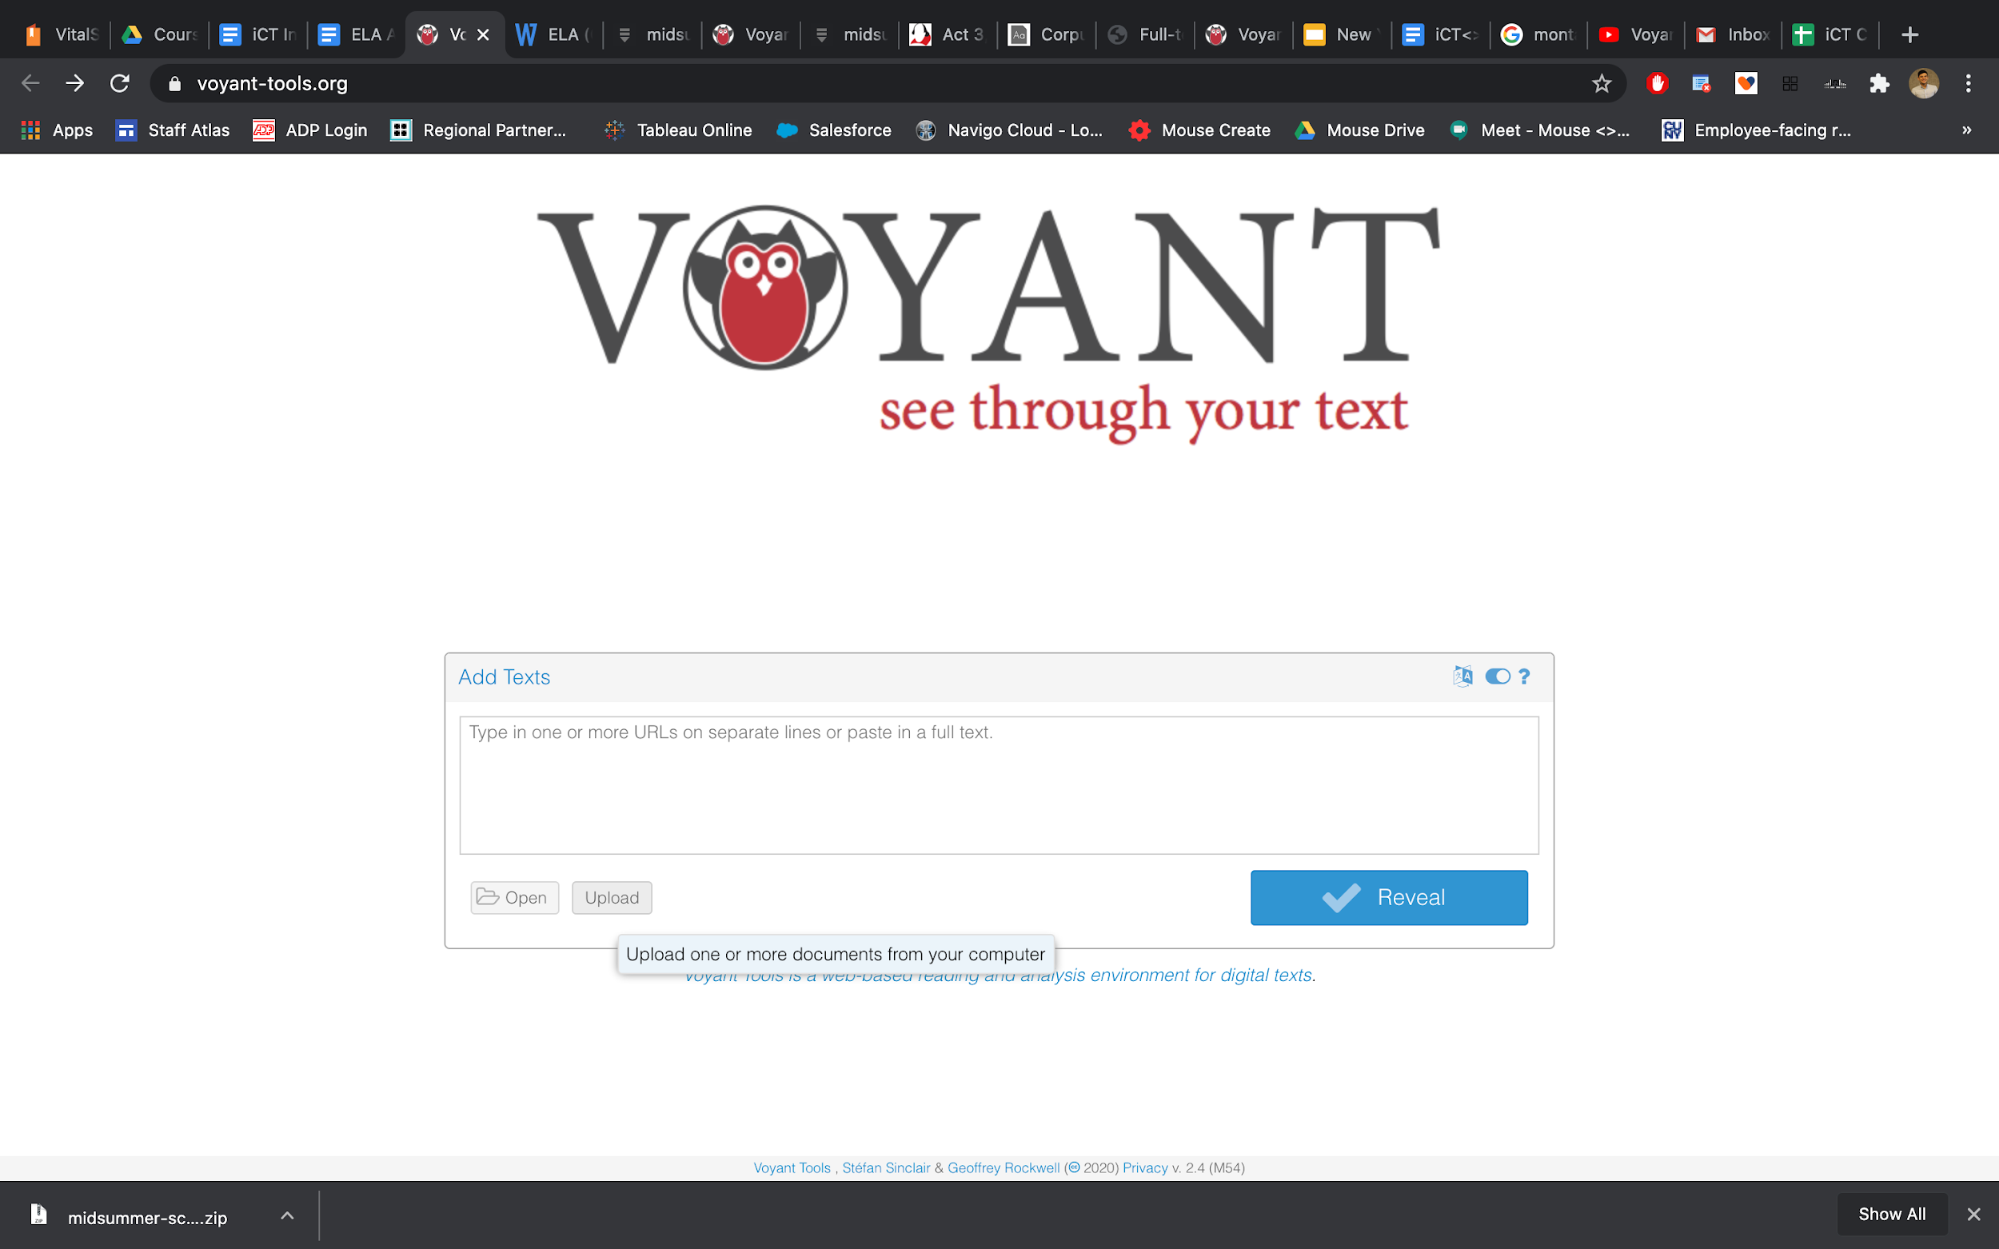
Voyant (https://voyant-tools.org) allows you to upload a text file from your computer by clicking the upload button. The Open button allows you to examine a large corpus (all of Shakespeare’s plays) that has been uploaded to the website. Finally, you can paste text or URLs to the text box. For this activity, we will be uploading a file from our computer.
For this activity, we will be examining Midsummer Night’s Dream. Which can be found in the following Google folder: https://drive.google.com/file/d/0B1_nfA-Ygm2iTnpnNUg1OTNVSnc/view
To download these files you will need to click on the download button on the top right hand of your browser’s window.
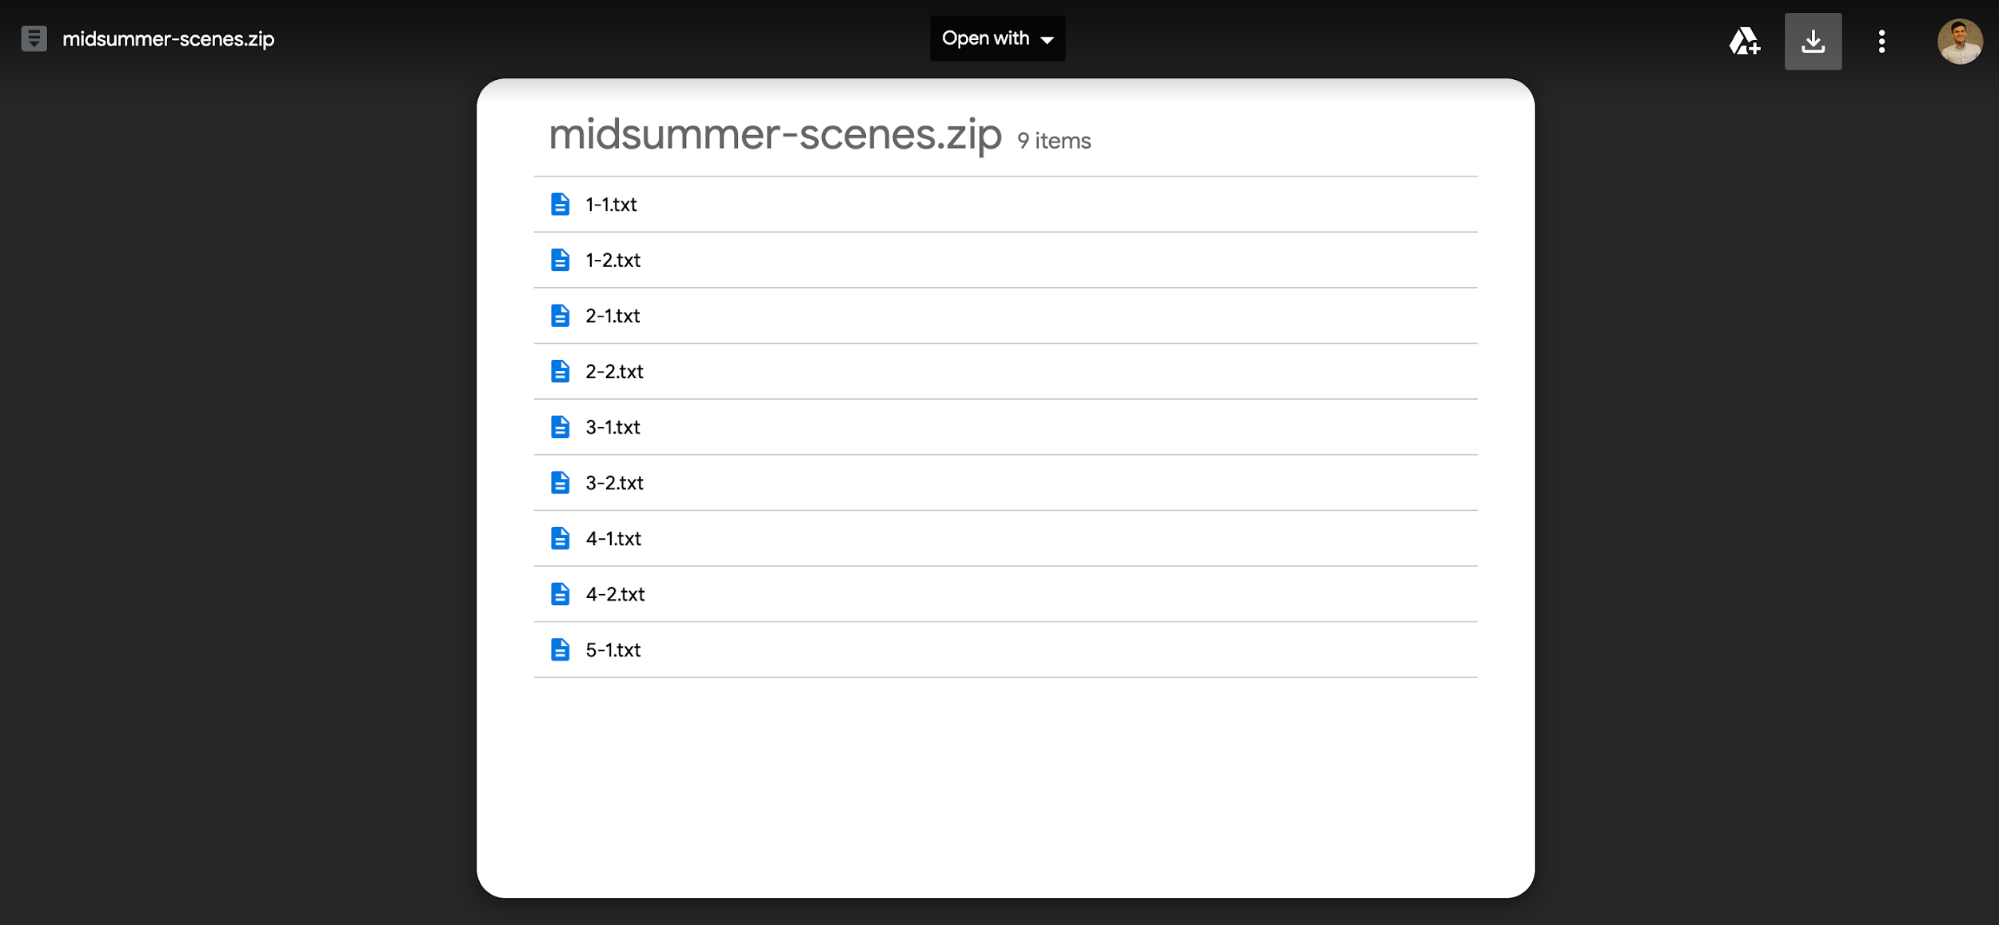
After hitting the download button, go to your computer’s download folder and locate a file by the name of midsummer-scenes.zip.
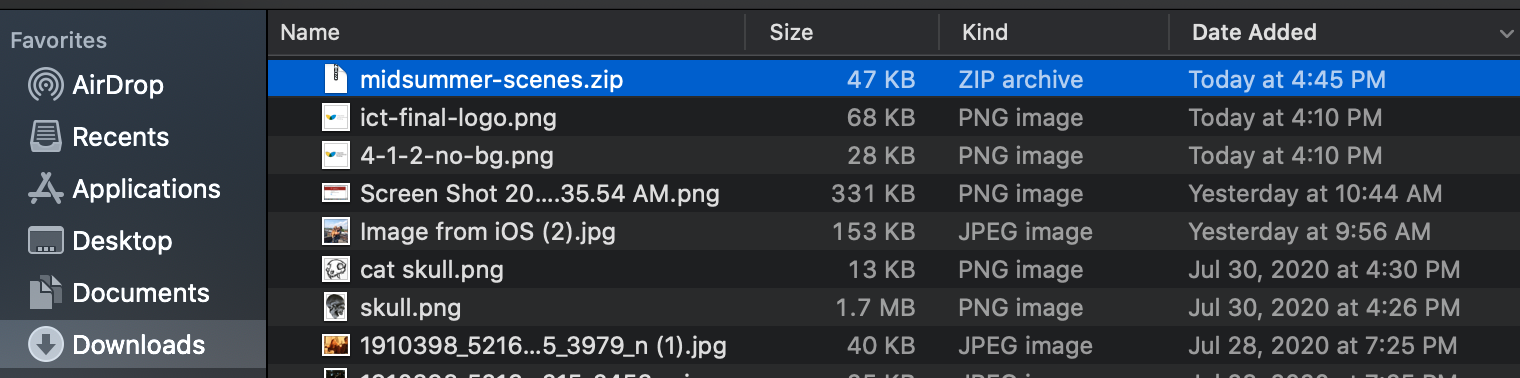
To open a zip file on a Mac, double click the file and a new folder will appear above the .zip with the same name.
To open a zip file on a Windows device:
- Open File Explorer, and find the zipped folder.
- To unzip the entire folder, right-click to select Extract All, and then follow the instructions.
- To unzip a single file or folder, double-click the zipped folder to open it. Then, drag or copy the item from the zipped folder to a new location.
Go to https://voyant-tools.org and click the Upload button.
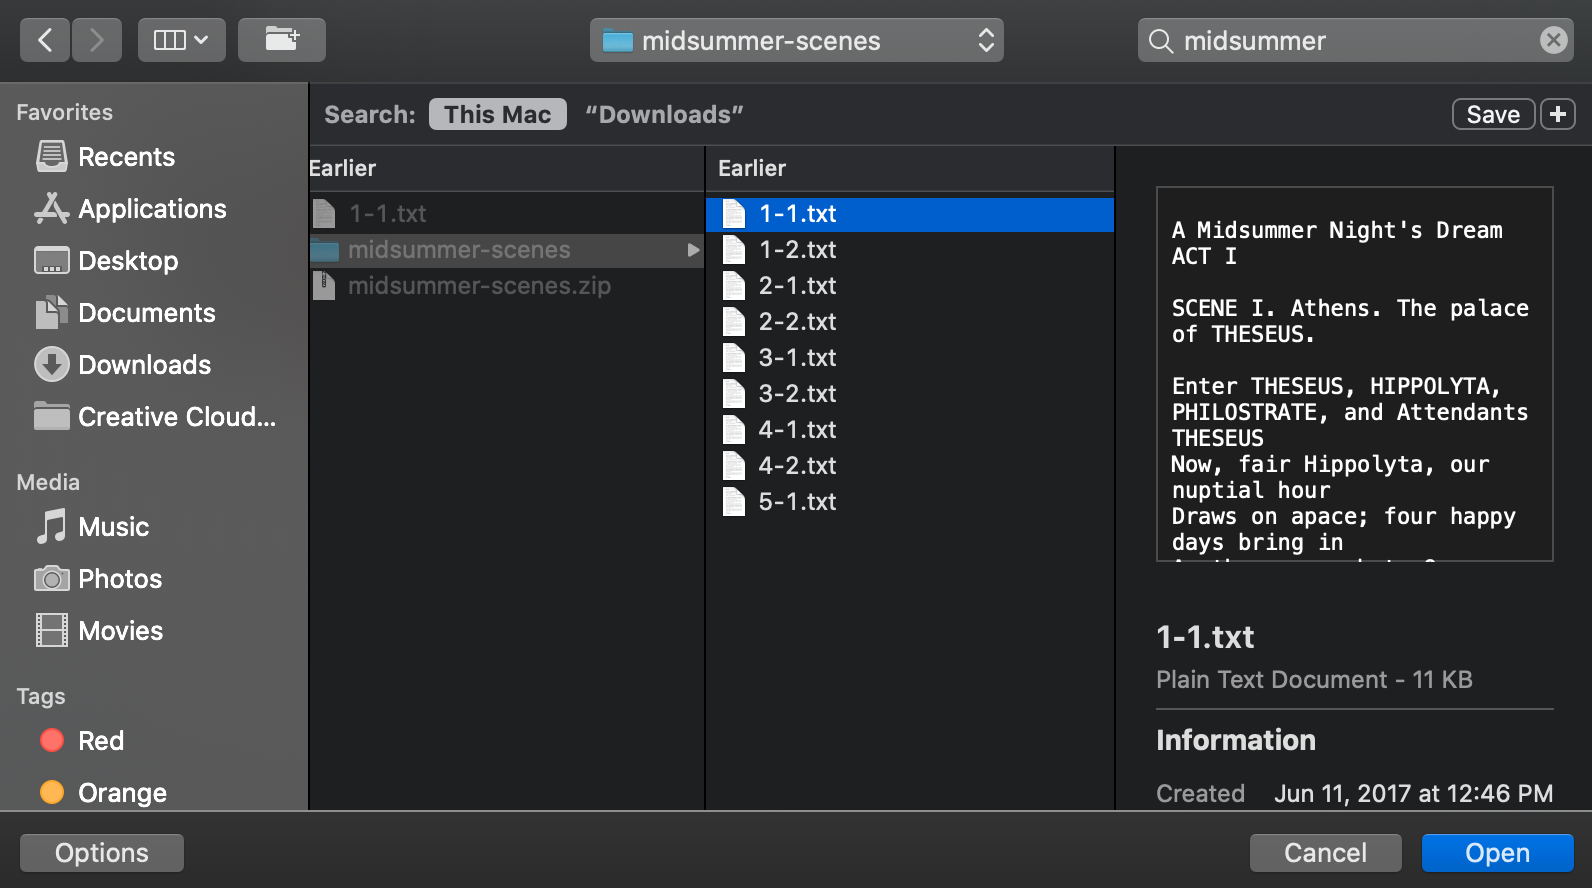
A window will pop up that contains all the files in your computer’s download folder. If your file is not at the top, use the search bar to look up the word “midsummer.”
Select the file then select file 1-1.txt and click the open button. Your text files will take a couple of seconds to upload to Voyant, larger files will take longer.
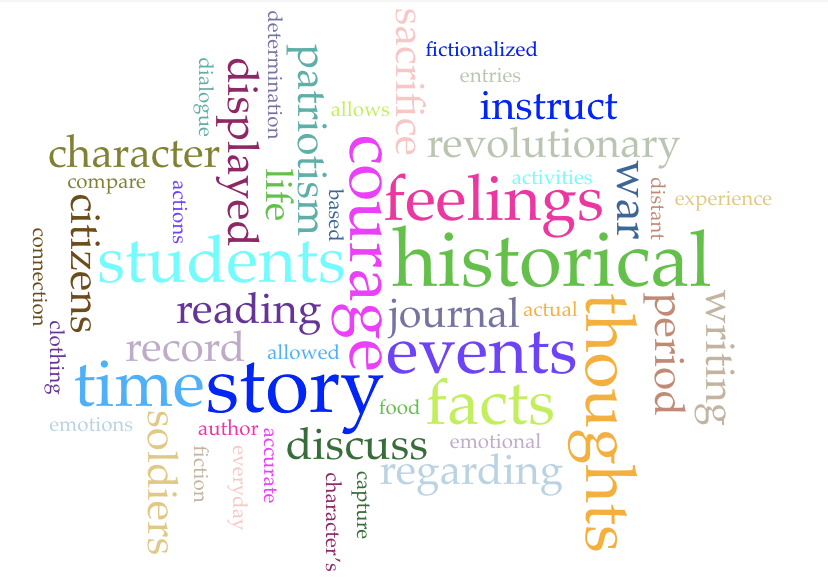
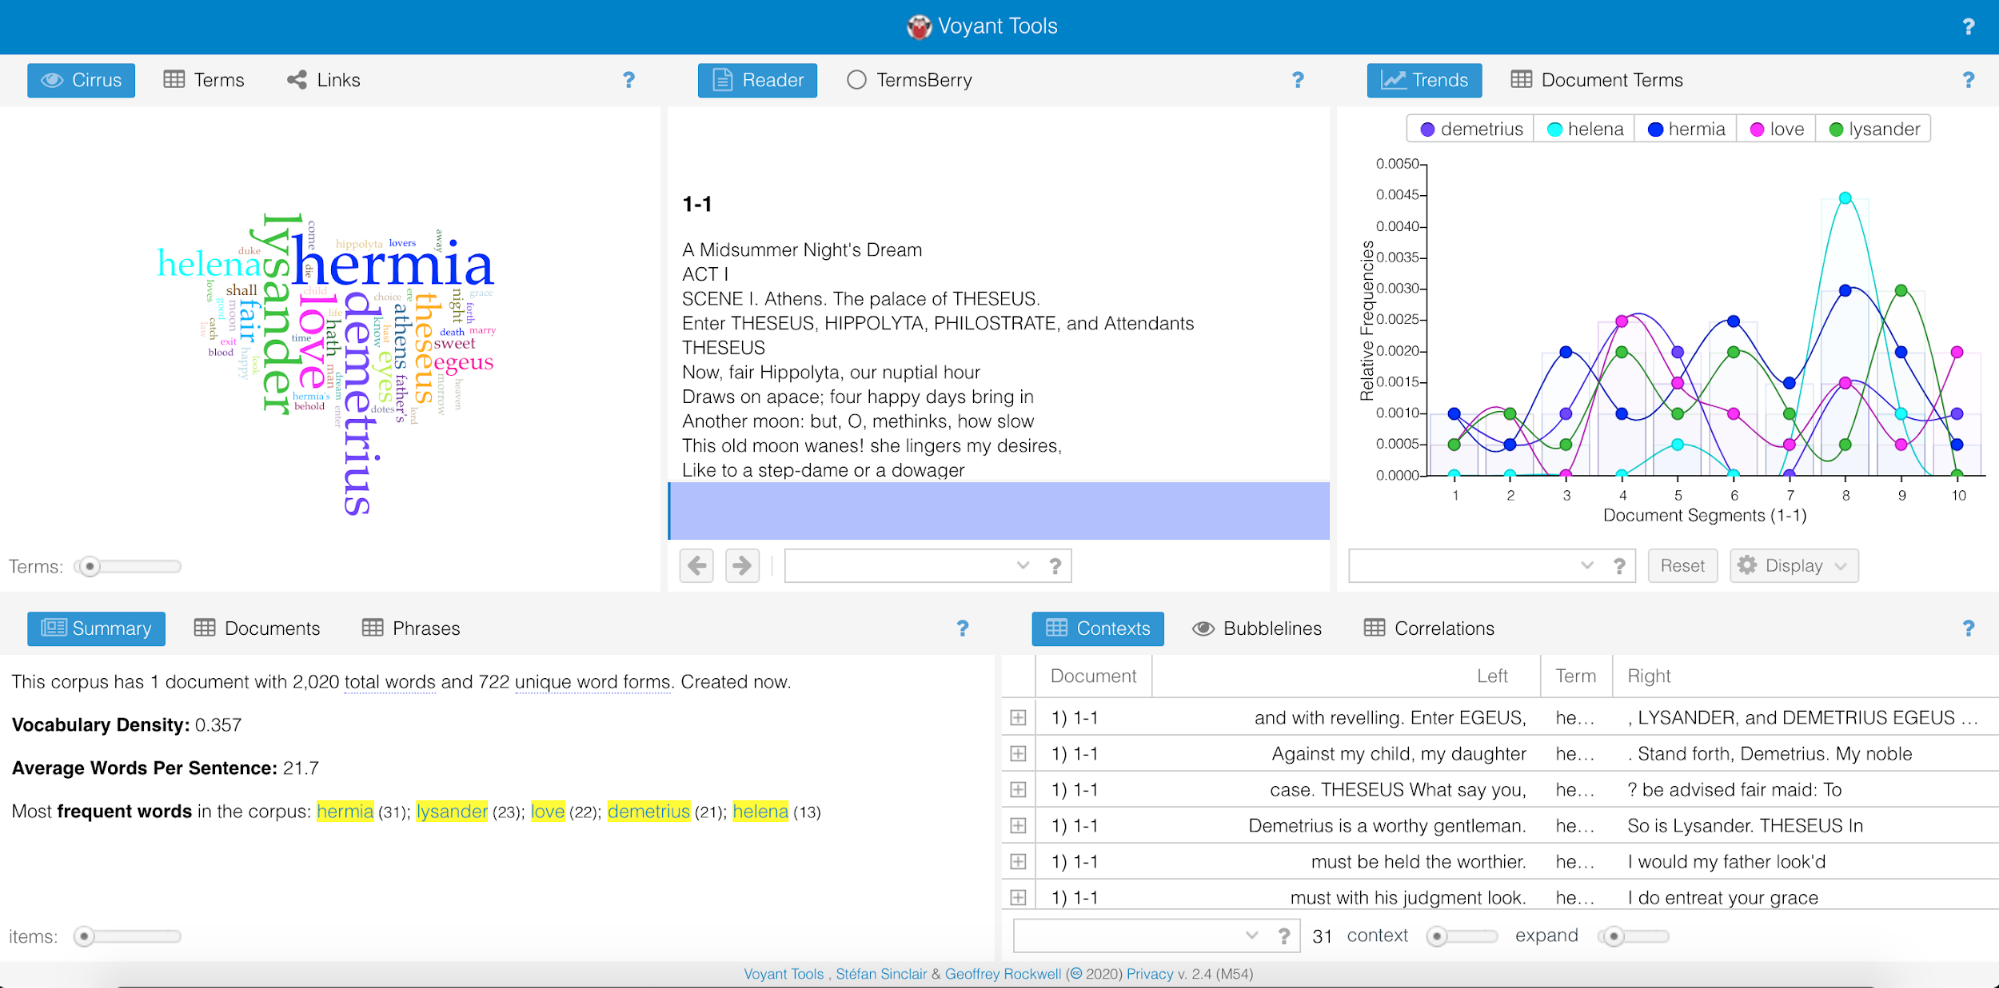
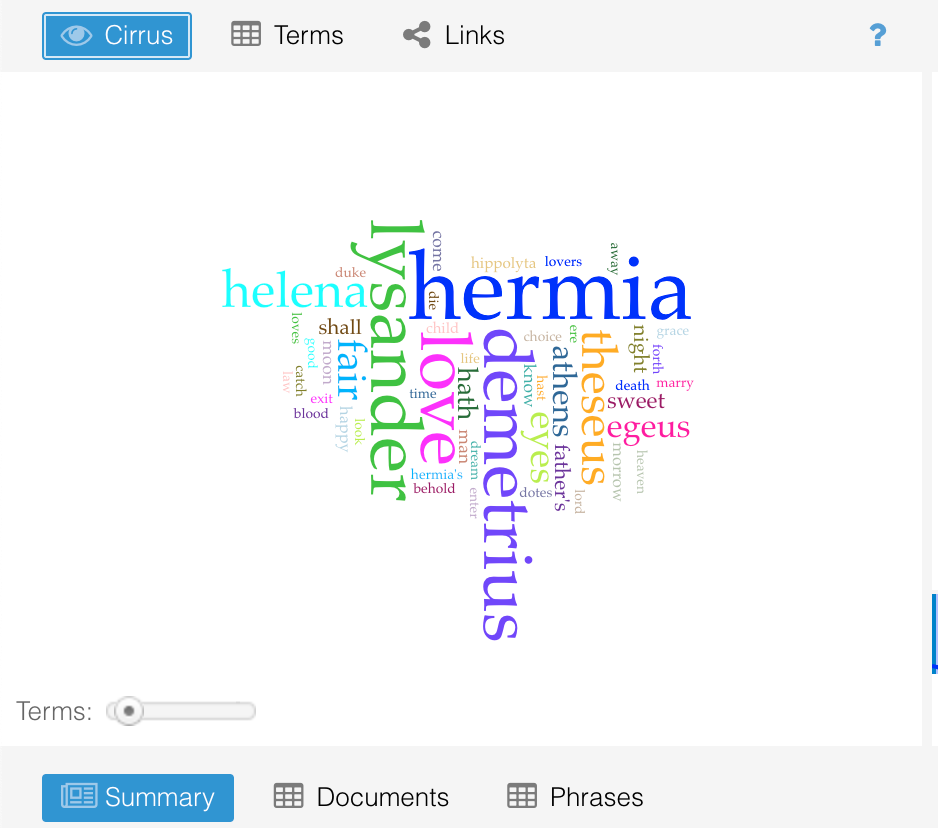
Explore the Voyant interface, examining the word clouds, keywords in context, and line graphs.
A thing to note about plays, character names tend to be some of the most frequently used words in the text. Care to guess why? You guessed it, names denote each character’s lines.
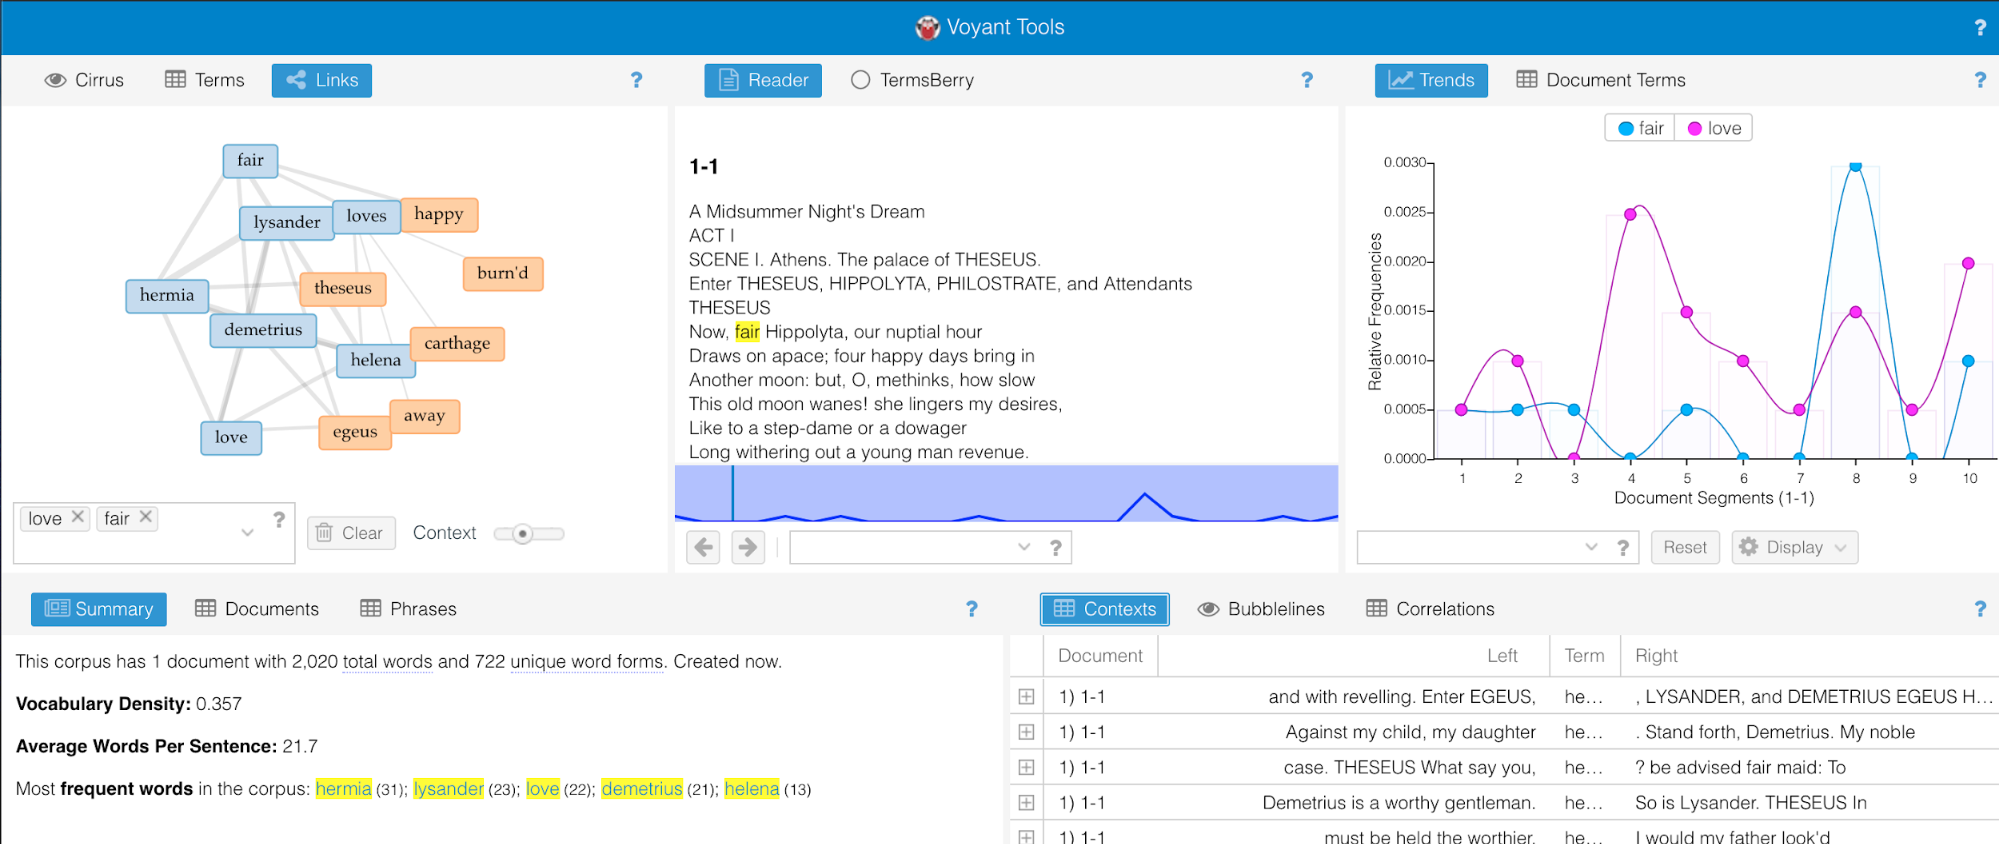
Your window should look like this:
As you play around with buttons and boxes, think about:
- What can a tool like Voyant allow us to see about texts that we might not be able to see otherwise?
- What do you find confusing about the tool?
Next you will compare how often the words “love” and “fair” are used.
First, find the section with the word cloud. The filter automatically selected for the word cloud will be set to Cirrus; select the filter Terms which will be to the right. Find the word love and select it by clicking the box to it’s left.
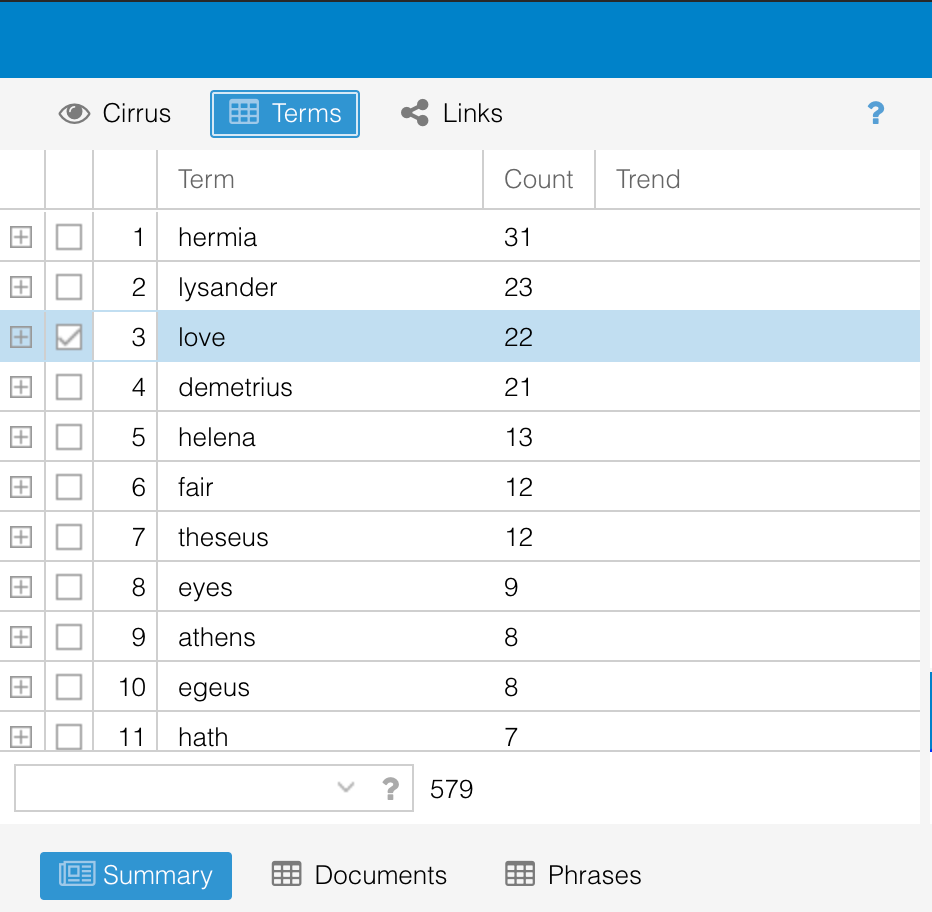
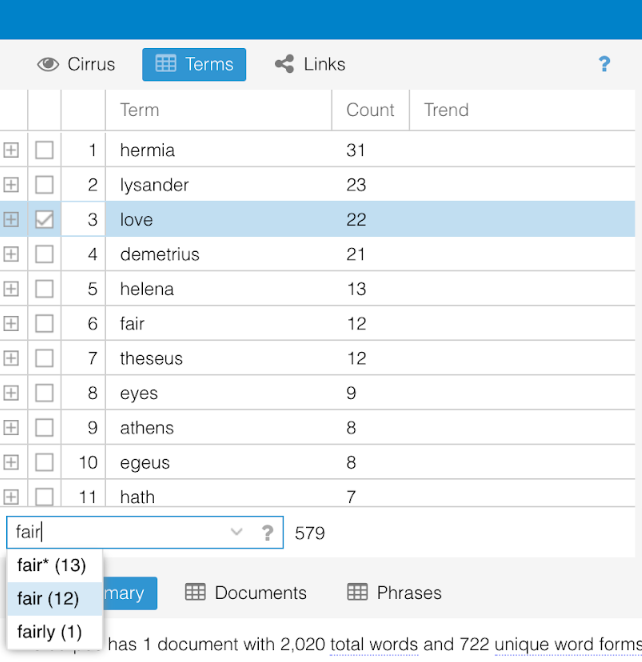
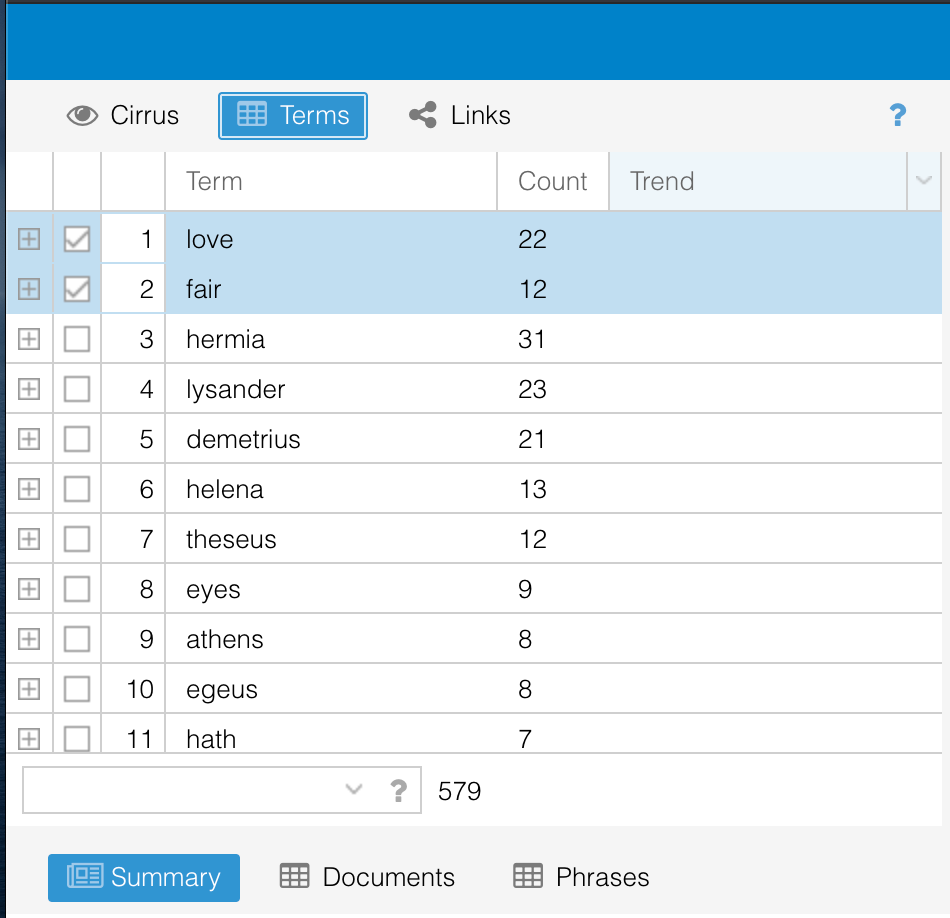
You can see that love is one the third most frequent word in Act 1, Scene 1. How can you find and select the word fair? Luckily it is the sixth most common but if it wasn't, how could you locate it? Find the search bar (right above the Summary, Documents, and Phrases buttons) and type in the word fair. Also tick the box left of the word to select it.
Now, let’s explore the final filter Links. If you click on the button. You will see the top ten most common words. But where is the word fair? To add it to this visualization, like in the prior filter locate the search bar and type the word. Hit enter and fair will appear on the web (collocates graph).
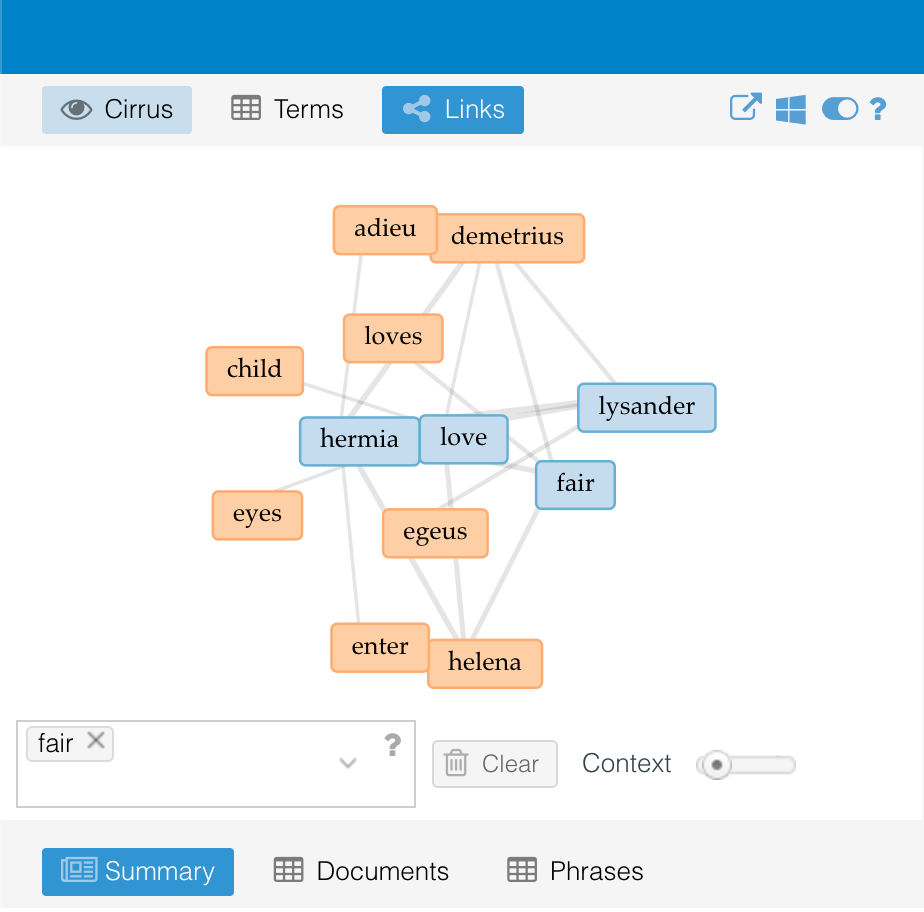
The collocates graph displays a network graph of higher frequency terms that appear in proximity. Keywords are shown in blue and collocates (proximal words) are orange. Click on the question mark icon in the upper right corner of the word cloud box to learn more.
Next, examine the entire window now to note how visualizations have changed. The Reader window now highlights the words fair and love. The Trends graph plots the two terms' relative frequency throughout ten segments of Act 1, Scene 1.
Examining the information presented, come up with some answers or hypotheses to the following questions:
- How often are these words used?
- When do the words occur?
- How do they relate to other frequently used words? How about collocates (proximal words, orange)?
- Can you make any predictions about the text based on any of this information? How might these predictions change if you were to add the entire play to Voyant?
- Would you feel more confident with your predictions if you were to be able to examine the entire play? Why?
After reflecting on these questions, play around with Voyant. Select new terms, and explore the Context, Bubblelines, and Correlations buttons. If you encounter any problems or have questions, hovering over the blue question mark icon may provide some answers.
Now you will use quantitative evidence gathered from Voyant Tools to answer the following questions: What is the most important word in A Midsummer Night’s Dream?
To do so, you will need to upload all of the play’s acts and scenes to Voyant Tools. Follow the process for uploading Act 1, Scene 1. Alternatively, you may also try uploading a URL of the entire play (http://shakespeare.mit.edu/midsummer/full.html)
After uploading the text and examining data and visuals, what is the word you selected and what is your reasoning? What data from Voyant Tools can you reference to support your hypothesis?

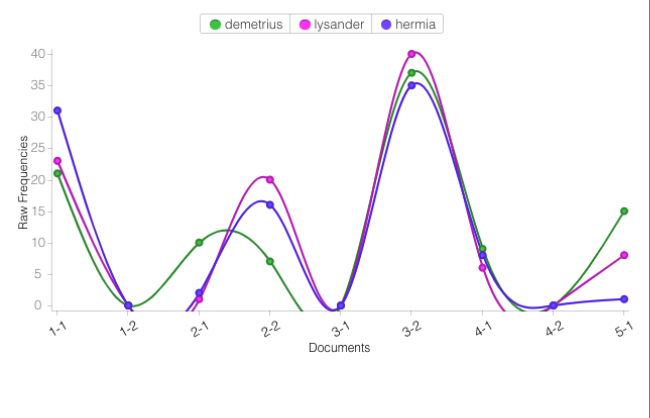
Following are two pieces of data from A Midsummer Night’s Dream: a line graph showing word frequency of how often Demetrius, Lysander, and Hermia’s names appear in the entire play and an excerpt from Act 3, Scene 2.
Studying evidence from Voyant Tools while annotating the excerpt for author’s use of literary devices, formulate a hypothesis with at least two quantitative and two qualitative pieces of evidence to respond to the following: Did Demetrius ever have a chance to win Hermia’s love away from Lysander?
From ACT 3, SCENE II. Another part of the wood.
DEMETRIUS
O, why rebuke you him that loves you so?
Lay breath so bitter on your bitter foe.
HERMIA
Now I but chide; but I should use thee worse,
For thou, I fear, hast given me cause to curse,
If thou hast slain Lysander in his sleep, [5]
Being o’er shoes in blood, plunge in the deep,
And kill me too.
The sun was not so true unto the day
As he to me: would he have stolen away
From sleeping Hermia? I’ll believe as soon [10]
This whole earth may be bored and that the moon
May through the centre creep and so displease
Her brother’s noontide with Antipodes.
It cannot be but thou hast murder’d him;
So should a murderer look, so dead, so grim. [15]
DEMETRIUS
So should the murder'd look, and so should I,
Pierced through the heart with your stern cruelty:
Yet you, the murderer, look as bright, as clear,
As yonder Venus in her glimmering sphere.
HERMIA
What’s this to my Lysander? where is he? [20]
Ah, good Demetrius, wilt thou give him me?
DEMETRIUS
I had rather give his carcass to my hounds.
Reflection
☞ What was your hypothesis and what evidence did you use to arrive at it?
☞ What units of study that you currently teach could abstraction be integrated in? How would using the computational thinking practice of abstraction strengthen or enhance the unit’s ELA learning objectives?
☞ After completing this activity, find other texts and upload them to Voyant Tools. Project Gutenberg has many free e-texts. https://www.gutenberg.org/ebooks/