Segregation by neighborhoods is a difficult topic to discuss and to teach. How is it that citizens that claim they value diversity end up living in neighborhoods with predominantly only one race?
Thomas C. Schelling, was an economist who asked these same questions and thought there might be more to neighborhood segregation than what first appears. He designed the model that we are going to use in this project first as an offline activity using pennies and nickels to represent different races of people and was surprised by the patterns that emerged if a penny tried to live where just two of his six closest neighbors were also pennies.
Before you launch the online version of this simulation, predict what you think Thomas Schelling might have found. What kinds of neighborhoods emerged when citizens sought a neighborhood that was at least a little like them?
What is the purpose of this exercise?
Science classes often conduct a practice of isolating a single variable and documenting the effects it has on an entire system. In this activity, you will apply this (often referred to as "The Scientific Method") in a Social Studies context.
Through the use of the online simulation tool NetLogo, you will experience how isolating a single factor related to a social and historical issue can change the way that issue or event is studied. In completing this exercise you will reflect on the benefits and potential dangers of this practice that can be applied across the Social Studies curriculum.
NetLogo Web: Segregation is an online simulation that offers a way for you to watch patterns of segregation emerge. As an online simulation, you can change different variables to see how the outcome changes (or doesn’t).
To start, go to the simulation, NetLogo Web: Segregation
Scroll down to the bottom of the screen and discover several collapsed windows (in purple) that you can click to expand. To read more about:
- What the model is simulating and how to operate it in detail click on Model Info
- To see (and change) the code that is making this simulation operate click on NetLogo Code
This simulation is modeling patterns of movement based on an individual's desires to live around others that are “similar.” The default setting is that orange and blue squares represent two different types of people. Both orange and blue are happiest when at least 30% (the default) of people are similar. If the percentage drops below that, they are considered unhappy, and become represented with an X. They then move to an area that matches their desired 30% or higher.
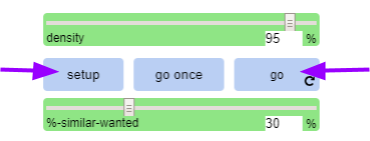
To try this simulation out, click on setup and then go.
Notice what happens. How do the patterns change?
Try answering the following questions:
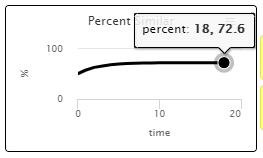
- How many “turns” does it take before the patterns have changed and all citizens are “happy.” (You can hover over the graph to see the number of turns, X, and the % of happy citizens, Y).
- What is the percentage of similar neighbors when everyone is “happy”?
- Why do you think this percentage is different from the percentage the simulation is set at (30%)?
Now try playing around with the sliders a bit.
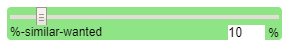
Change the desired percentage by adjusting the slider for %-similar-wanted either up or down. How did the patterns change with this new value? How did the number of turns change? What about the percentage of similar neighbors once everyone is “happy”?
Also try interacting with the slider for population density. What effect does changing the population density have on the emerging patterns, and percentage of “happy” neighbors? What is not included in this simulation? What elements would you add to make this simulator more historically accurate?
Reflection
Reflect on what you've done in this project and answer the following questions:
☞ How did the fact that this simulation focused on just one factor at a time help you understand housing segregation differently? What is useful about being able to focus on one factor and manipulate that factor in isolation?
☞ What danger(s) could come from focusing on one factor while leaving out other factors that relate to housing segregation? Could these dangers negatively impact policies with good intentions aimed to curb this issue?