
In this lesson, you will learn about mass incarceration in America through data visualizations. Mass Incarceration is defined as:
“The current American experiment in incarceration, which is defined by comparatively and historically extreme rates of imprisonment and by the concentration of imprisonment among young, African American men living in neighborhoods of concentrated disadvantage” (Source: Oxford)
What is the purpose of this exercise?
The process of manipulating raw data and structuring it into a visualization doesn't change any facts but often changes the way the data is perceived. While you study and create your own data visualizations on the topic of Mass Incarceration, consider the power a visualization can have on public opinion and the impacts that can have on society in the past, present, and future.
In this step, you will study several visualizations to compare how different factors like race, age, and region affect the experiences of Americans in the criminal justice system.
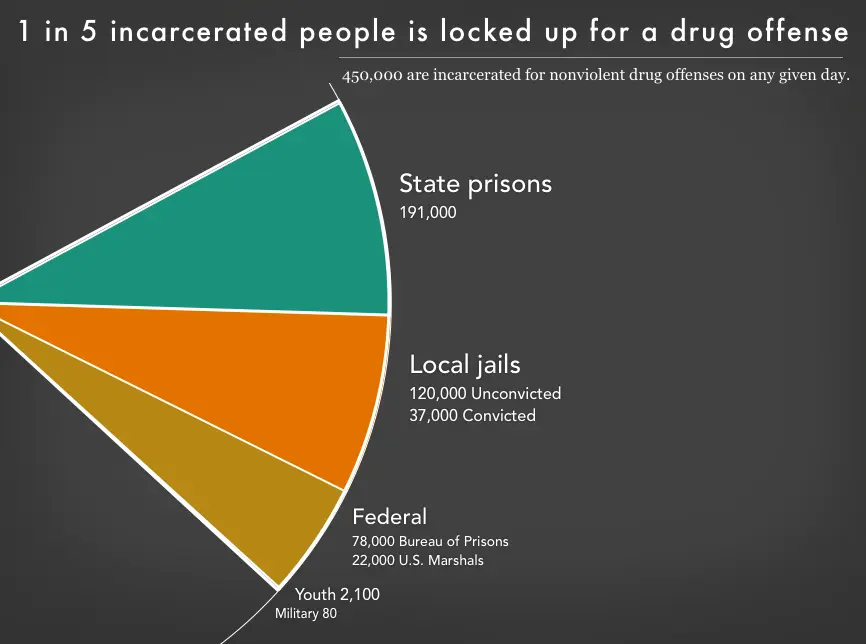
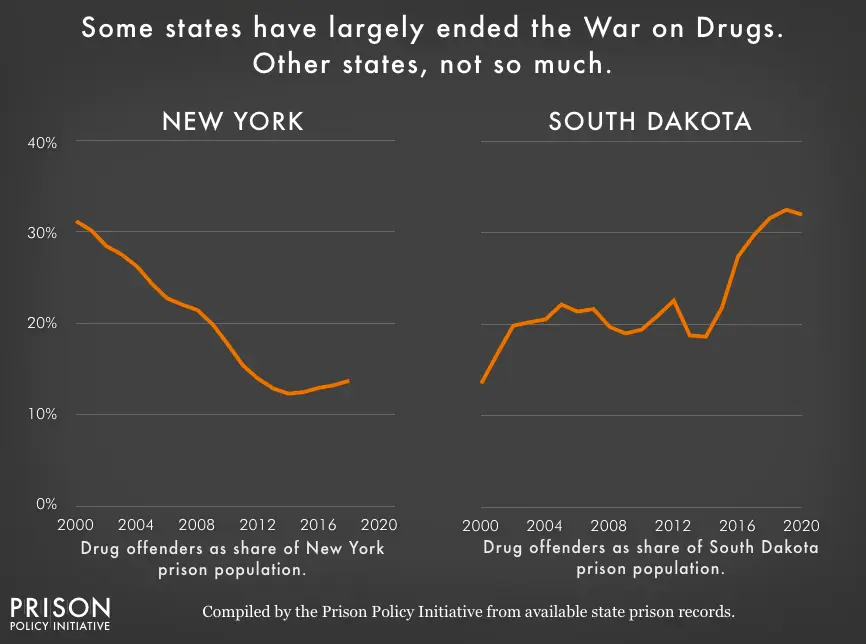
First, we will look at mass incarceration overall in America. Spend 5-10 minutes learning from these visualizations created by the Prison Policy Initiative.
Reflection
Based on the visualizations you just reviewed answer the two questions below:
☞ What additional questions do you have about mass incarceration after what you have observed in this chart?
☞ Do you feel these charts have a specific bias or viewpoint they are trying to convey with data? Explain
In the previous step, you examined incarceration data across the United States, in this step you will examine incarceration data broken down by states and race. Consider the state you live in, what assumptions do you have about incarceration when compared to other states in the country?
Now that you have made your assumptions, put them to the test by studying this interactive map that compares imprisonment rates between states using data from the Sentencing Project. Be sure to click “Full details and/or compare” to see the full data.
Now you will use the patterns you observed earlier to create your own visualization. Examples of visualizations you can create are a simple pie chart or bar chart.
To create your own visualization you will first choose which data you will use. For example, I might compare the White custody rate and Black custody rate in Michigan. In this case, the data I will use are the two custody rates: 96 and 479 per 100,000, respectively. You may also use facts not listed in the two visualizations provided to you (e.g. state population, US race demographics). Please note, if you are going to use data not provided to you in this project then you will need to locate a credible source and cite it properly.
Once you decide on the data you will want to visualize, create a new spreadsheet in the software of your choice. We suggest either Google Sheets or Microsoft Excel. Once you have a spreadsheet created, add your data before moving on to the next step
Now that you have a spreadsheet with the data you collected in it, you will use that data to create your own visualization in a spreadsheet tool of your choice. Here are some resources to help you create visualizations. Feel free to search the internet for other guides (e.g. “how to make a pie chart in Google sheets”)
- How to Make a Bar Chart in Microsoft Excel
- How to Create and Format a Pie Chart in Excel
- How to make a bar graph on Google Sheets
- How to Make a Pie Chart in Google Sheets
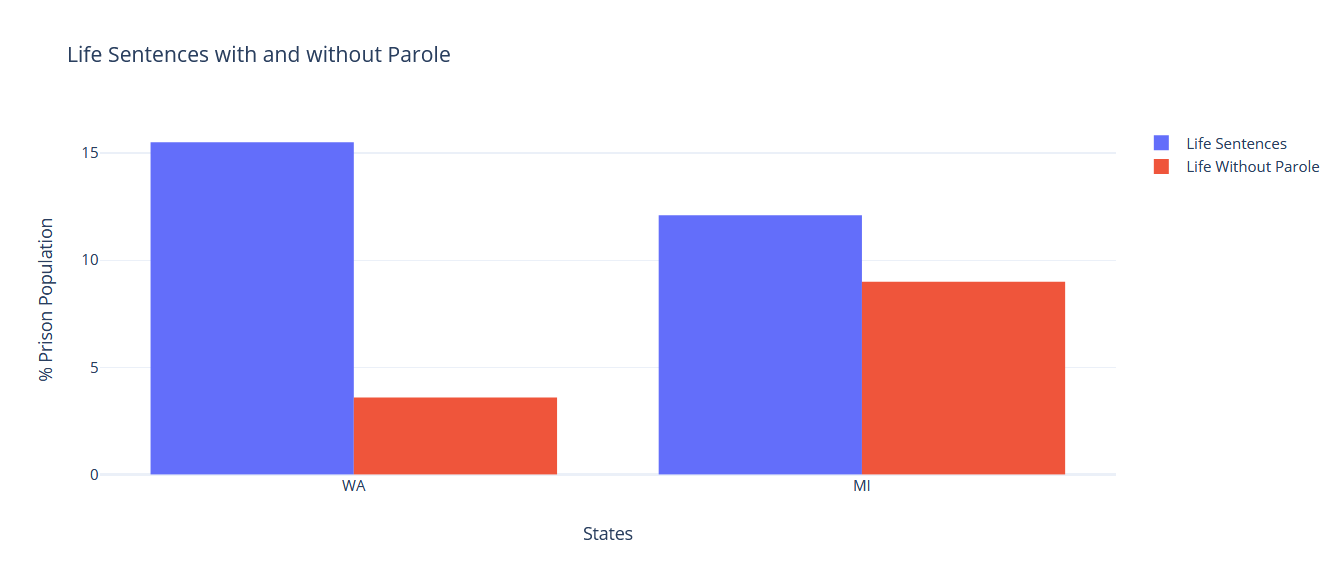
Example: the bar charts below illustrate that Washington state has a higher percentage of life sentences than Michigan, but Washington has a lower percentage of life without parole sentences
Reflection
☞ Consider the data you collected in your spreadsheet and compare it side-by-side with your visualization. Which set of information would you use to help guide a conversation you might lead on this topic. Defend your answer.
☞ Can you think of a different way to present your data that might tell a different story to the viewer? How can changing which data you emphasize; such as using bright colors, different spacing, even how you title the graph give your data a specific viewpoint?